國立成功大學 近海水文中心 Coastal Ocean Monitoring Center, National Cheng Kung University (COMC, NCKU)
Pile Station
1. Overview
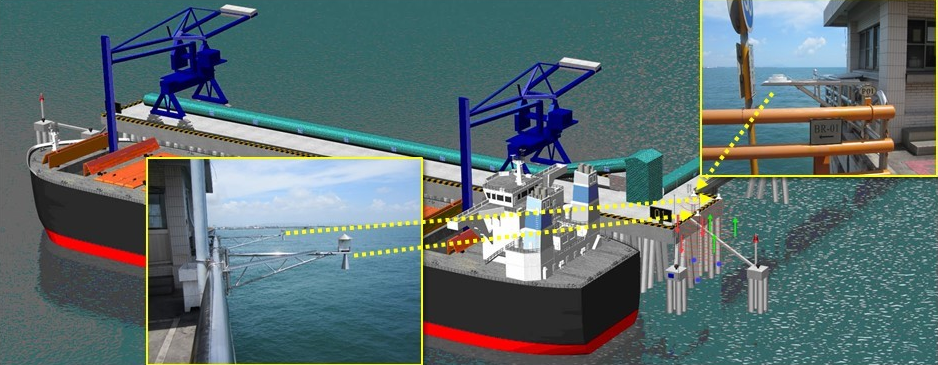
Collecting marine meteorological data at sea is far more challenging than on land. As a result, various international observation platforms have been developed to carry sensors and instruments for data collection. Among these, the ocean observation pile (fixed observation tower) serves as a stationary automatic marine meteorological observation station at sea. In addition to dedicated observation piles, existing offshore fixed structures—such as wind measurement towers and offshore coal unloading pier—are sometimes also utilized for marine and meteorological observations.
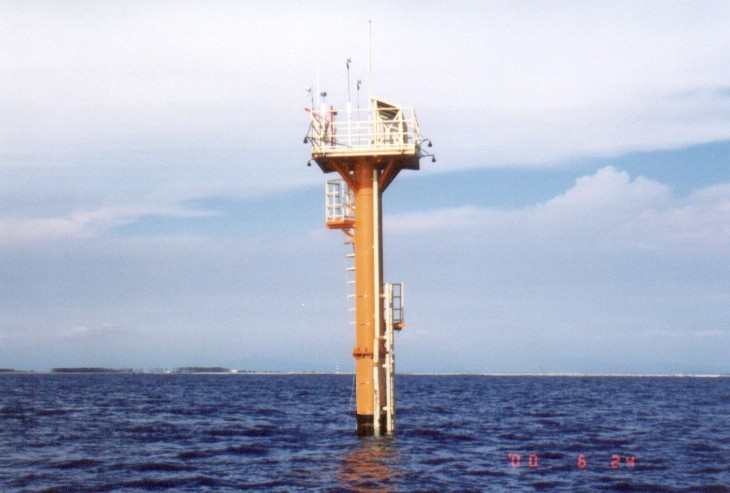
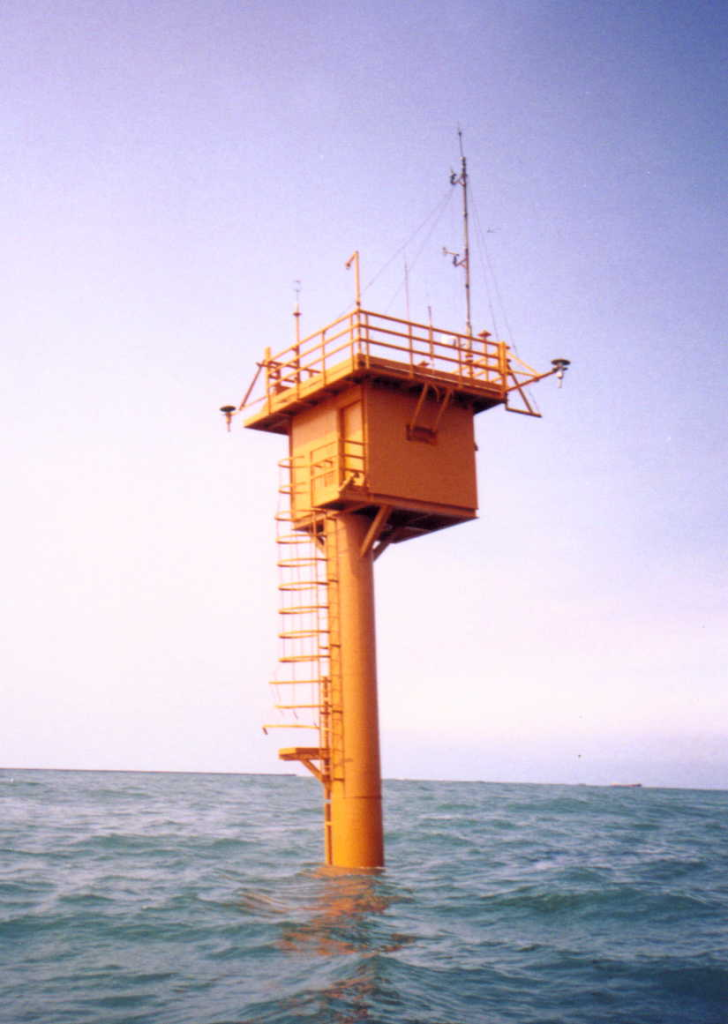
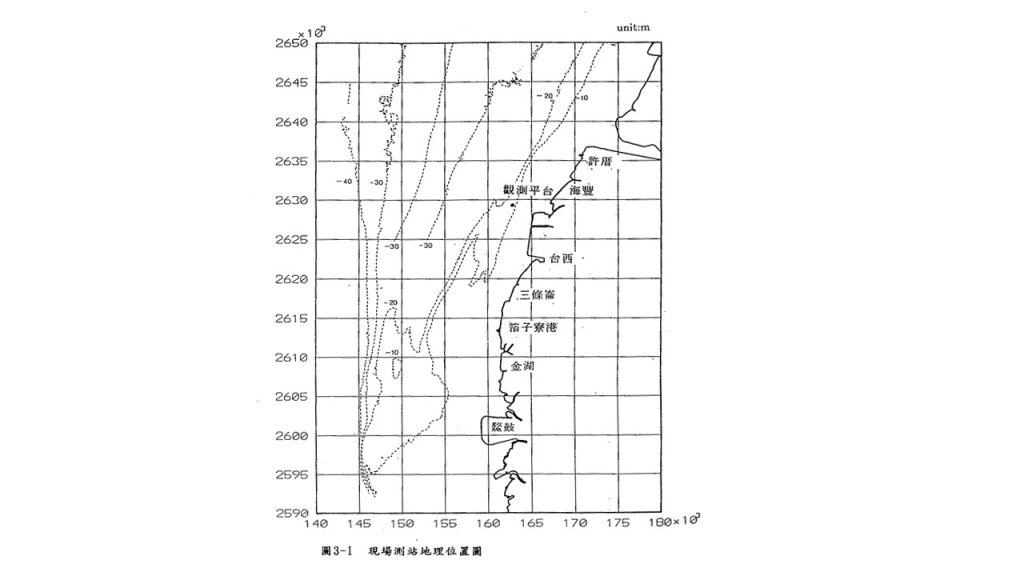
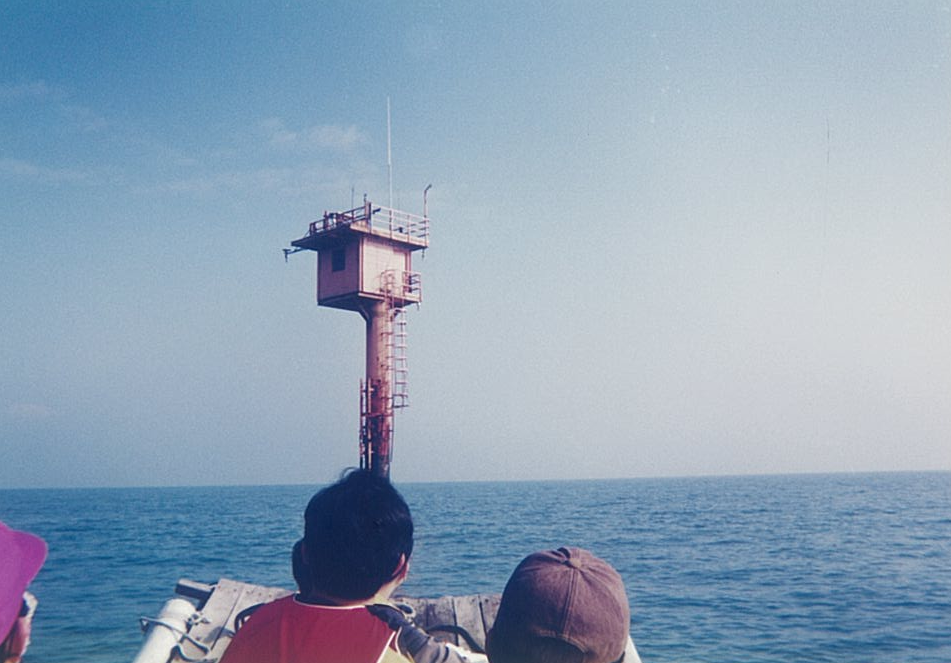
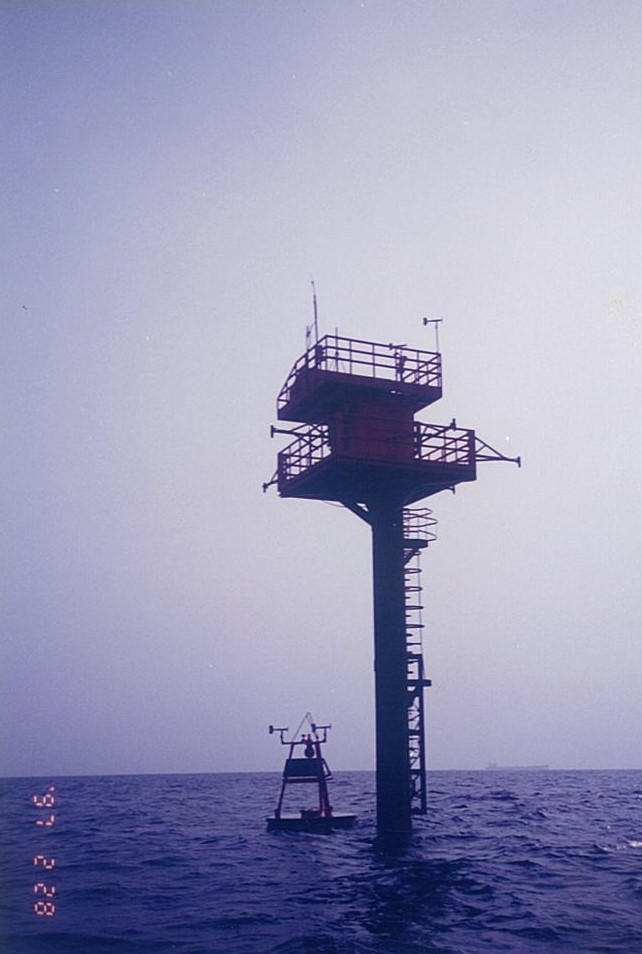
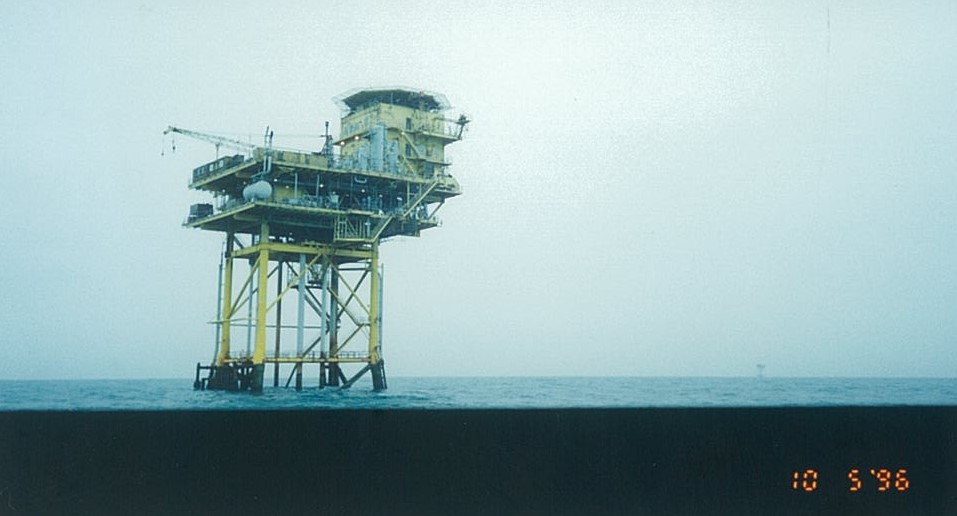
Common oceanographic observation parameters include water temperature, tides, and waves, while meteorological observations include air temperature, air pressure, and wind. Even before the establishment of the COMC, research had already been conducted on water level telemetry from observation piles and the analysis of directional wave spectra. Dedicated observation piles have been deployed off the coasts of Taichung and Taixi, and the technology has been applied to other platforms such as the Kaohsiung and Qigu offshore observation piles, the coal unloading pier of Taipower’s Hsinta Power Plant, CPC’s Guoguang Platform in Hsinchu, the offshore coal unloading pier of Taipower’s Hsinta Power Plant, and the offshore wind measurement tower in Changhua. In addition to developing and applying directional wave spectrum analysis techniques, COMC has actively introduced advanced remote sensing instruments and developed system integration technologies to improve the quality of observational data. Furthermore, the Institute of Transportation, MOTC, has also established observation piles—such as the Taipei Port observation pile, which is equipped with wind measurement capability.
2. System Architecture and Specifications
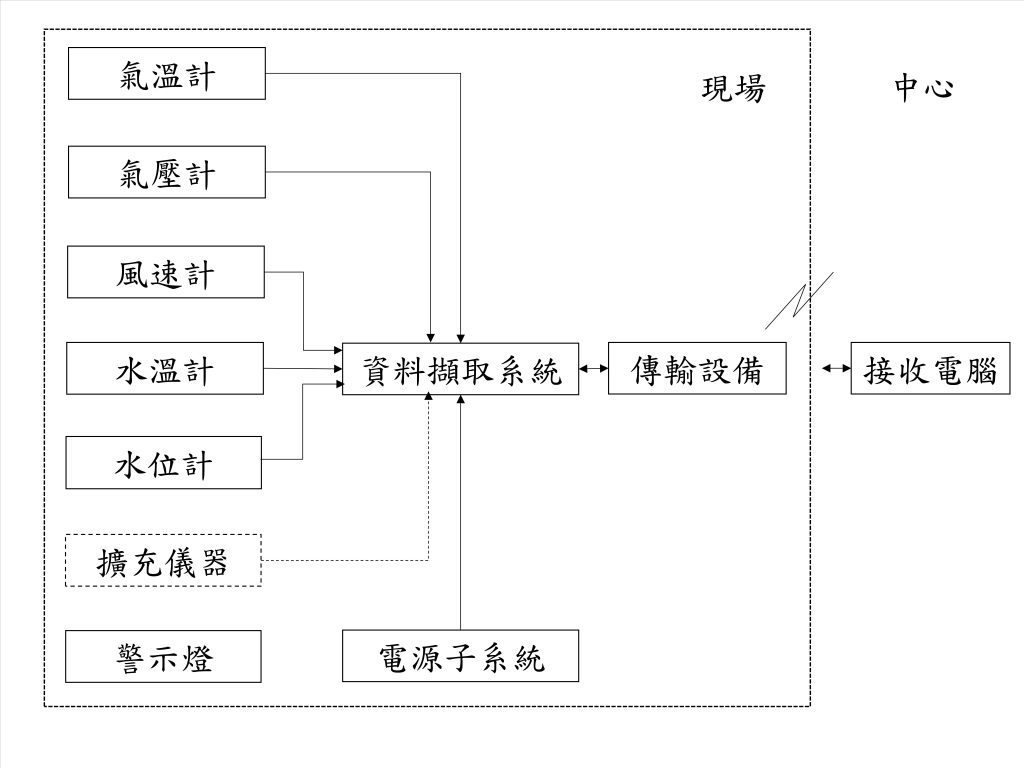
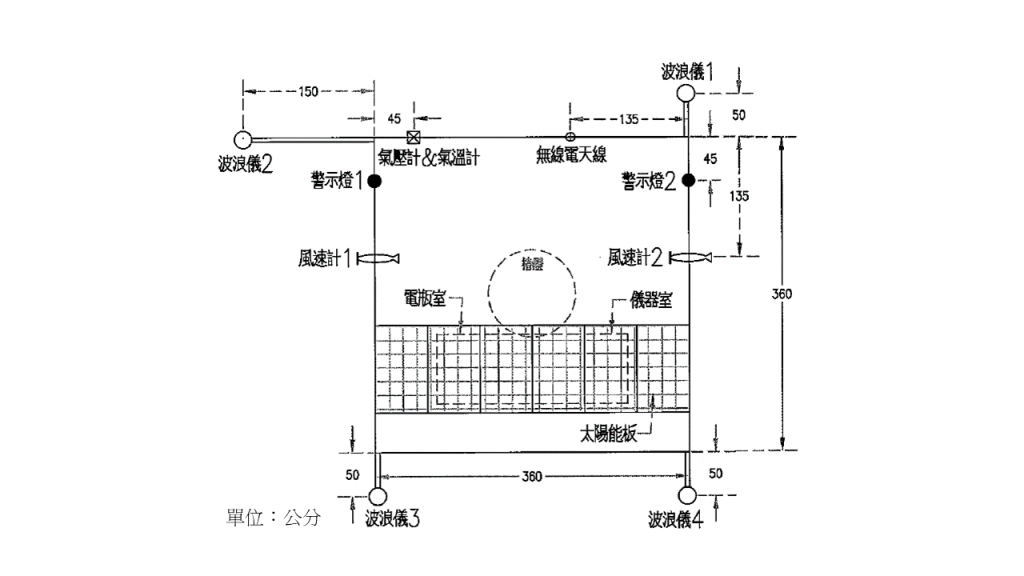
Figure 1 shows the system architecture of COMC’s marine meteorological observation pile, where sensors are selected based on their suitability at the time of deployment and can be upgraded as sensing technologies advance. For example, earlier systems used centimeter-level ultrasonic tide gauges for water level and directional wave spectrum analysis, while the latest systems employ radar tide gauges with millimeter-level accuracy. Through the development of the data acquisition system, the sensors, power subsystems, and transmission equipment are integrated into a unified observation system. This design allows the system to be highly scalable and customizable to meet diverse marine meteorological observation requirements. Figure 2 provides an example of the system’s structural dimensions, designed according to the platform specifications of the Qigu marine meteorological observation pile. The size of each observation system can be adjusted based on the platform dimensions of the observation pile at each site.
Figure 1. Operational Observation System of the Coastal Ocean Monitoring Center
Figure 2. Example Diagram of Observation System Dimensions
Instrument
Measurement Range
Accuracy
Thermometer
-40 ~ 60 ℃
0.2 ℃
Barometer
800 ~ 1,100 hPa
1.8 hPa
Anemometer (Propeller Type)
0 ~ 100 m/s
±0.3 m/s
Anemometer (Ultrasonic Type)
0 ~ 65 m/s
±0.2 m/s
Wind Vane (Propeller Type)
0 ~ 360°
3°
Wind Vane (Ultrasonic Type)
0 ~ 360°
2°
Water Temperature Sensor
0 ~ 50 ℃
0.05 ℃
Radar Water Level Gauge
Up to 70 m
±3 mm @distance ≤ 30 m ±0.01% F.S. @distance > 30 m
3. Observation Principles
Among the observation items of the marine meteorological observation pile, wave observation is one of the most complex. Its fundamental principles can be divided into two parts: the sensor system and the directional wave spectrum analysis, as described below.
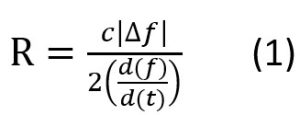
SensorCOMC has introduced the Frequency-Modulated Continuous-Wave (FMCW) radar, a modern remote sensing instrument capable of measuring sea surface elevation from the observation pile for use in directional wave spectrum analysis. The FMCW radar determines water level variations by measuring the distance between the radar and the sea surface, as expressed in Equation (1).
Directional Wave Spectrum
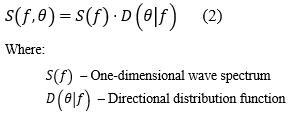
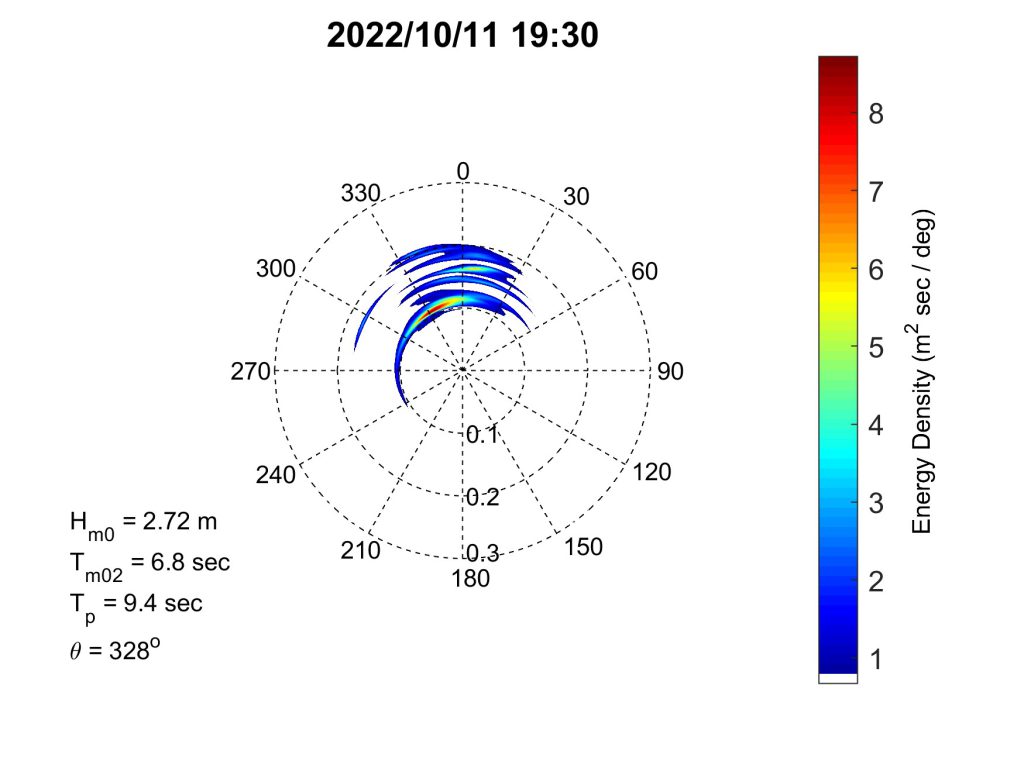
The directional wave spectrum is defined as the product of a one-dimensional wave spectrum and a directional spreading function, as shown in Equation (2).
The one-dimensional spectrum can be derived from the observed water level data using the Fast Fourier Transform (FFT). The directional spreading function can then be estimated using one of several methods, such as the Truncated Fourier Series Method, Maximum Likelihood Method, Bayesian Directional Method, or Maximum Entropy Method, including their modified forms. The directional spreading function must satisfy Equation (3). Based on Equation (4), and through the calculation of cross-spectra between water level measurements at different positions, a set of simultaneous equations can be established and solved to obtain the directional spreading function.
4. Installation Process
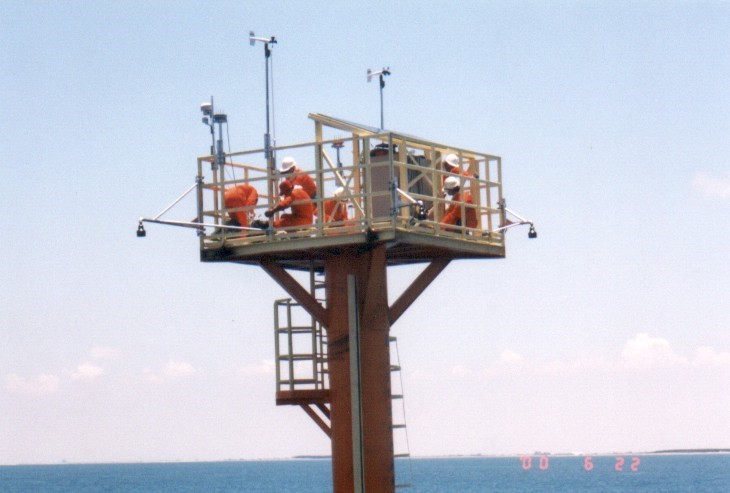
1. Installing observation instruments on the platform
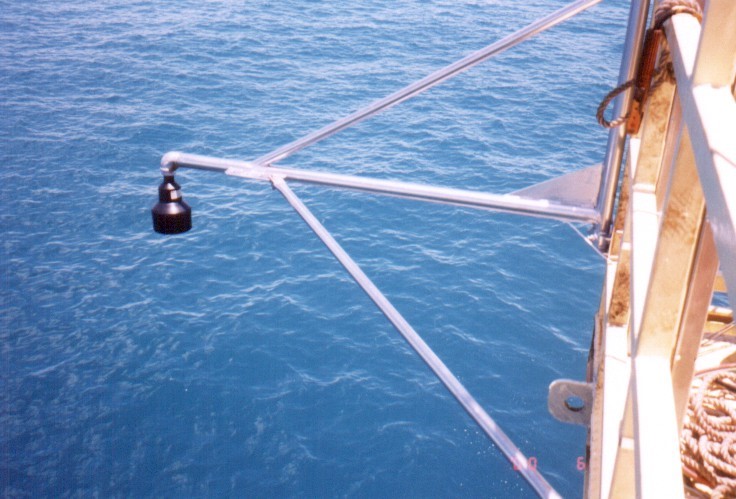
2. Installing the wave gauge main unit
3. Wave gauge installation completed
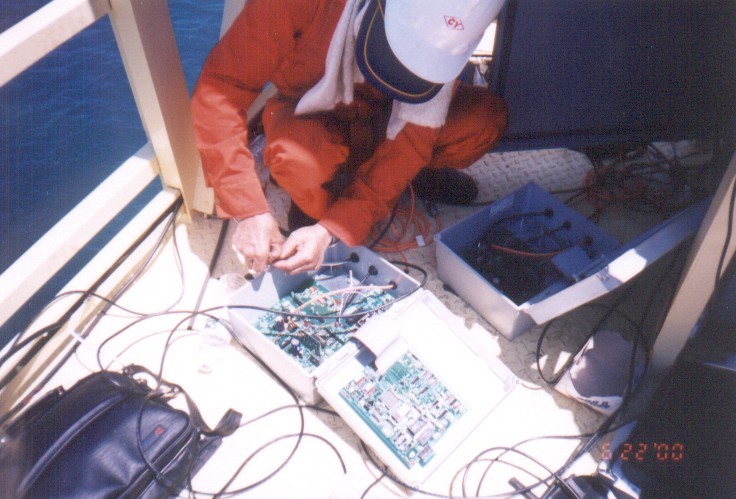
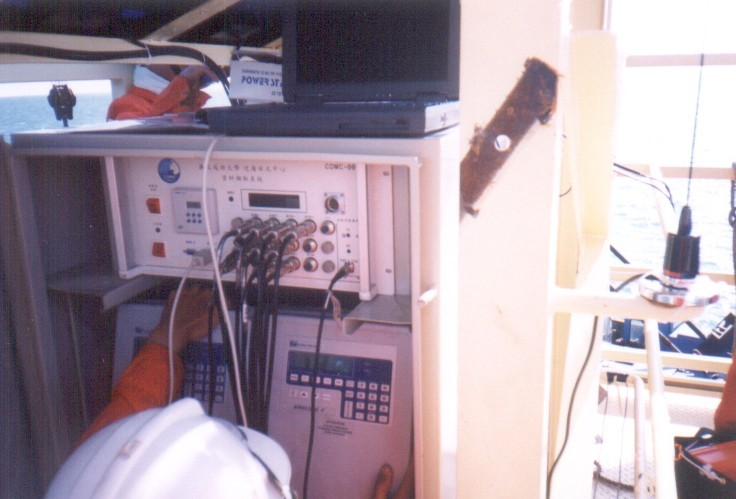
4. Installing and testing the data acquisition system
Before and after the establishment of the COMC, the COMC has developed and installed marine meteorological observation systems on both dedicated observation piles and various types of offshore platforms, including:
Coal Unloading Pier at Taipower’s Hsinta Power Plant