
國立成功大學 近海水文中心
Coastal Ocean Monitoring Center, National Cheng Kung University (COMC, NCKU)
Coastal Ocean Monitoring Center, National Cheng Kung University (COMC, NCKU)
Operational Oil Spill Model
Oil pollution incidents occur frequently in the waters surrounding Taiwan. In addition to accidents such as vessel groundings and pipeline leaks that may lead to oil spill dispersion, there are also frequent pollution events of unknown origin, all of which have varying degrees of impact on the marine environment and ecosystem. Most oil pollution events in Taiwan’s waters involve surface oil spills. During the processes of risk assessment and emergency response, wind and ocean currents are the primary factors influencing the drift and dispersion of surface oil. Therefore, hydrodynamic simulations using ocean numerical models (such as SCHISM), combined with wind fields provided by the Central Weather Administration’s numerical model (WRF), and supported by in situ observations (e.g., offshore data buoys, X-band radar, or TOROS HF radar), can provide oceanic and meteorological conditions for oil spill dispersion models (such as GNOME) to perform prediction or hindcast analyses. The simulated oil drift trajectories and affected areas can then be imported into cross-platform environmental sensitivity maps established in Google Earth, enabling the dynamic generation of time-evolving oil spill risk maps and risk level assessment tables. Based on this, an operational and communication platform for emergency response has been developed, which allows users to conveniently access the latest oil pollution risk information through computers or mobile devices running different operating systems, while also assisting in estimating and planning the quantity and deployment of response resources.
For example, on June 22, 2021, an oil spill occurred off the coast of Dalin, Kaohsiung, and the pollution drifted and dispersed toward the coasts of Xiaoliuqiu and Hengchun. In the early stages of the spill, the Ocean Affairs Council applied multiple advanced technologies—including satellite imagery, helicopters, and unmanned aerial vehicles (UAVs)—to detect the oil dispersion extent at various times and to assess the affected areas. Since this incident occurred in open waters, the combined effects of wind and currents expanded the impacted region. Therefore, the oil dispersion extents detected by the Ocean Affairs Council using these technologies were imported into the oil spill dispersion model as initial spill conditions, and the simulated results were further refined using forecasted wind and current fields from the meteorological and ocean models, improving the accuracy of the predicted oil drift trajectories and dispersion ranges.
Based on the information provided by the Ocean Conservation Administration of Ocean Affairs Council for the Dalin oil spill, parameters for the numerical simulation were established, and two oil dispersion simulations were performed. The parameters of the first simulation case were as follows: spill location at latitude 22°29’46.6” N and longitude 120°16’40.5” E; initial spill time at 02:00 on June 22, 2021; oil type: fuel oil; total spill volume: 50 m³; spill duration: 30 minutes; simulation period: 72 hours; forecasted wind field from WRF; forecasted current field from SCHISM. At the initial spill time (02:00 on June 22), Figure 1 shows the WRF-predicted wind field over the southwestern Taiwan Sea, where the arrows indicate wind direction and the colors represent wind speed. The results show that the wind direction near Xiaoliuqiu was approximately southwesterly, shifting to southeasterly near the Kaohsiung offshore area due to land influence, and turning easterly near Checheng Township in Pingtung County. Figure 2 shows the SCHISM-predicted current field for the same region, with arrows indicating current direction and colors representing current velocity. The simulation results indicate that the currents from Kaohsiung to Xiaoliuqiu flowed roughly south-southeast to southeast, turning easterly near the offshore waters of Checheng due to coastal topography. Figure 3 shows the GNOME-simulated oil drift and dispersion after 40 hours from the initial spill, revealing that the oil slick drifted toward Xiaoliuqiu under the influence of wind and current, without dispersing toward the Kaohsiung coastline. Figure 4 illustrates the temporal evolution of oil weathering proportions after 72 hours of the first GNOME simulation. The green dotted line represents surface oil, the red dotted line represents shoreline oil, and the blue dotted line represents evaporated oil. The trends indicate that the amount of shoreline oil around Xiaoliuqiu significantly increased between 16:00 on June 22 and 10:00 on June 23. This prediction result is consistent with the on-site investigation findings reported by the Ocean Conservation Administration of Ocean Affairs Council.
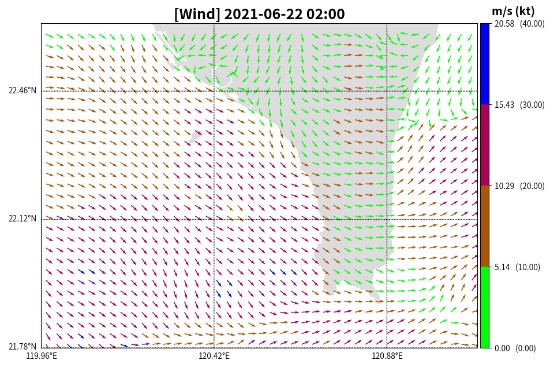
Figure 1. CWB-WRF forecast wind field at 02:00 on June 22

Figure 2. SCHISM forecast current field at 02:00 on June 22
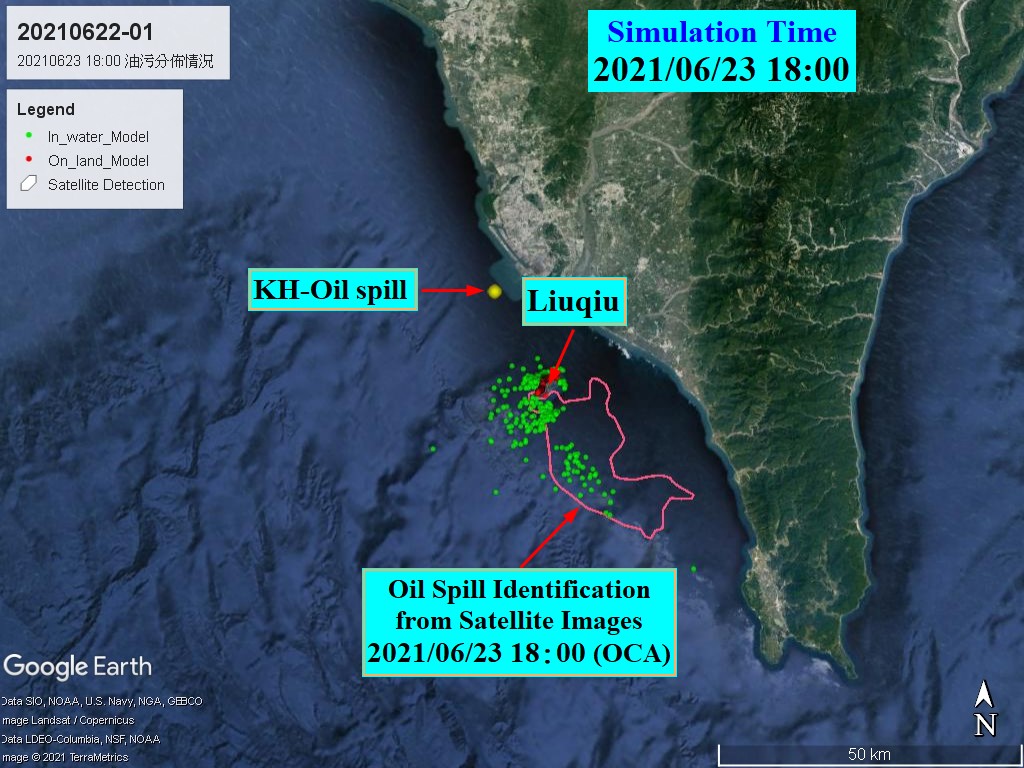
Figure 3. GNOME first forecast — simulated oil spill distribution on the sea surface 40 hours after the spill
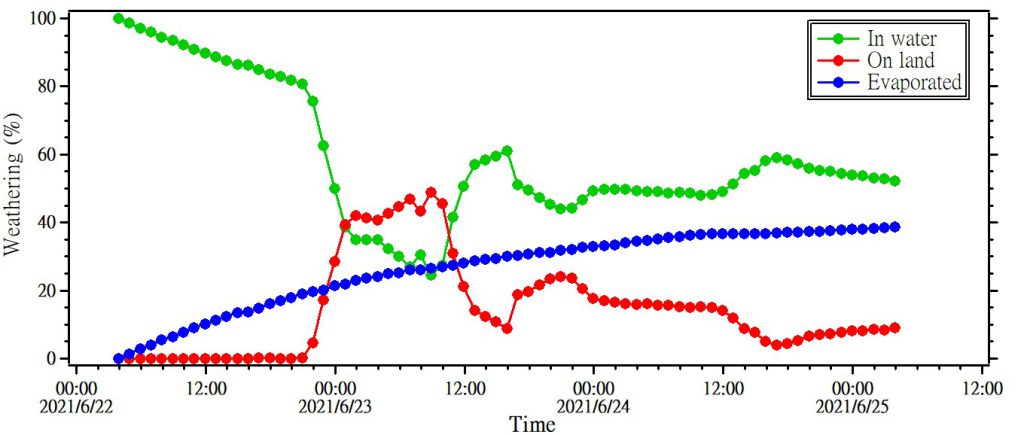
Figure 4. GNOME first forecast — evolution of oil weathering sequence 72 hours after the spill
Real oil spill incidents require continuous updates of various datasets to dynamically predict the future dispersion of the pollution based on the most recent information. In light of this need, the second prediction was conducted using the oil spill distribution identified from the satellite imagery provided by the Ocean Conservation Administration of Ocean Affairs Councilat 18:00 on June 23 as the initial condition for simulation, while continuously updating the meteorological and oceanographic forecast data. Figure 5 shows the simulated oil distribution on the sea surface 51 hours after the second prediction (at 06:00 on June 26). The results indicate that the oil pollution had reached the coastal waters near the National Museum of Marine Biology and Aquarium in Checheng Township, Pingtung County, with additional oil patches observed offshore of Checheng. This prediction closely matched the oil spill distribution detected by the National Academy of Marine Research via satellite imagery (highlighted in the orange box in the figure). Furthermore, aerial reconnaissance conducted by the Airborne Service Corps confirmed the presence of oil on the sea surface near the National Museum of Marine Biology and Aquarium area, verifying that the second prediction results can serve as a valuable reference for developing emergency response strategies for oil spill management.
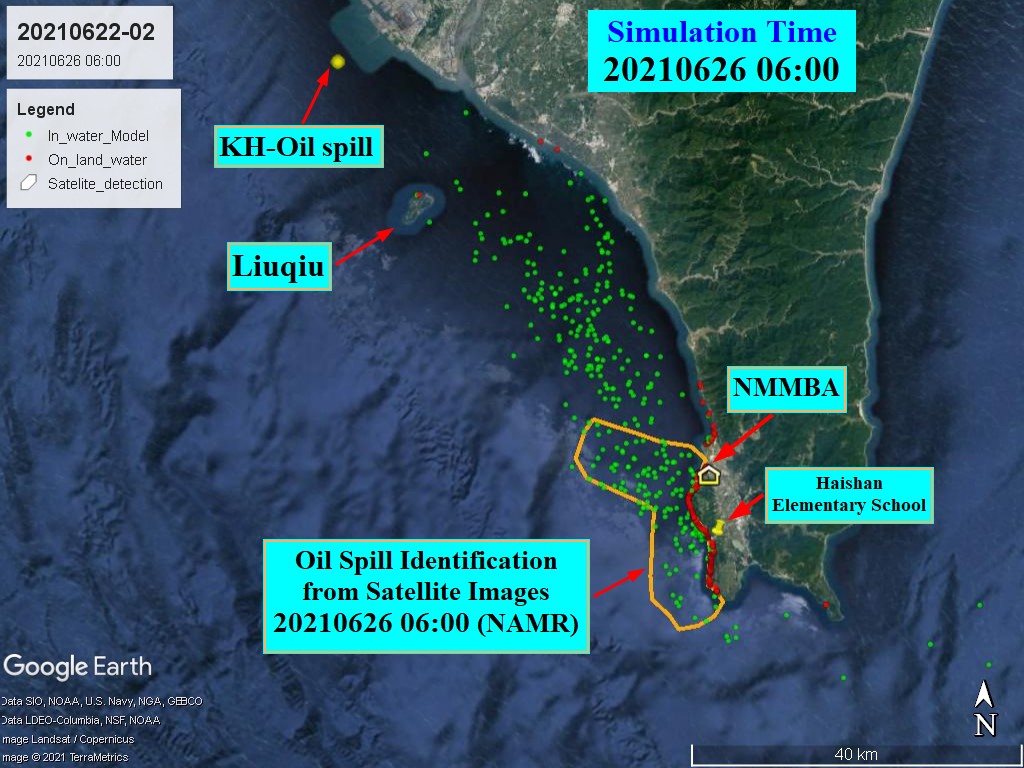
Figure 5. GNOME second forecast — simulated oil spill distribution on the sea surface 51 hours after the spill
Effective prediction of oil spill dispersion and drift trajectories is essential for assessing the potential impact area and associated risks of marine oil pollution. If real-time oceanographic and meteorological observations can be rapidly collected and numerical simulations initiated in the early stage of an oil spill incident, the oil spill dispersion model can be used to estimate the affected area over various time intervals. With the advancement of modern computational modeling, it is now possible to combine simulated and observed data from multiple sources according to the spill conditions, thereby improving the accuracy of trajectory and dispersion forecasts (Chuang et al., 2016; Chiu et al., 2018b), as well as providing recommendations for information integration in emergency response planning.